
Skip to content

Key Takeaways

Pest IT Logo Bird Icon Nettie Maguire    Square BG Transparent

The cost is a meter, not a mess. It keeps billing every week the birds are still there.

Pest IT Logo Bird Icon Nettie Maguire    Square BG Transparent

The line you can see, the cleaning, is the smallest. The damage and the stop sit underneath it.

Pest IT Logo Bird Icon Nettie Maguire    Square BG Transparent

The meter runs at the pressure you read in Session 1. Established and nesting means every line, climbing.

Pest IT Logo Bird Icon Nettie Maguire    Square BG Transparent

You are not selling a product. You are switching off a meter. That is how the quote lands.
A building manager walks you to the front canopy, points at the white mess streaked down the glass and the handrail, and asks for a price to clean it up. Fair question. It is the part he can see.

It is also the cheapest thing the birds are costing him. The cleaning is a receipt, not the bill. Under it sits the blocked box gutter backing water into the ceiling, the fitout ageing early under the roost, the slick patch by the doors that the risk register has not caught up with yet, and the morning the cafe downstairs cannot open its outdoor tables. None of that is on the canopy he is pointing at.

Session 1 taught you to read how committed the birds are. Session 2 taught you what your install teaches them. This session is the number those two produce. Because the flock that has settled onto a site is not a nuisance with a cleaning cost. It is a bill that keeps arriving, and most clients are only reading the top line.

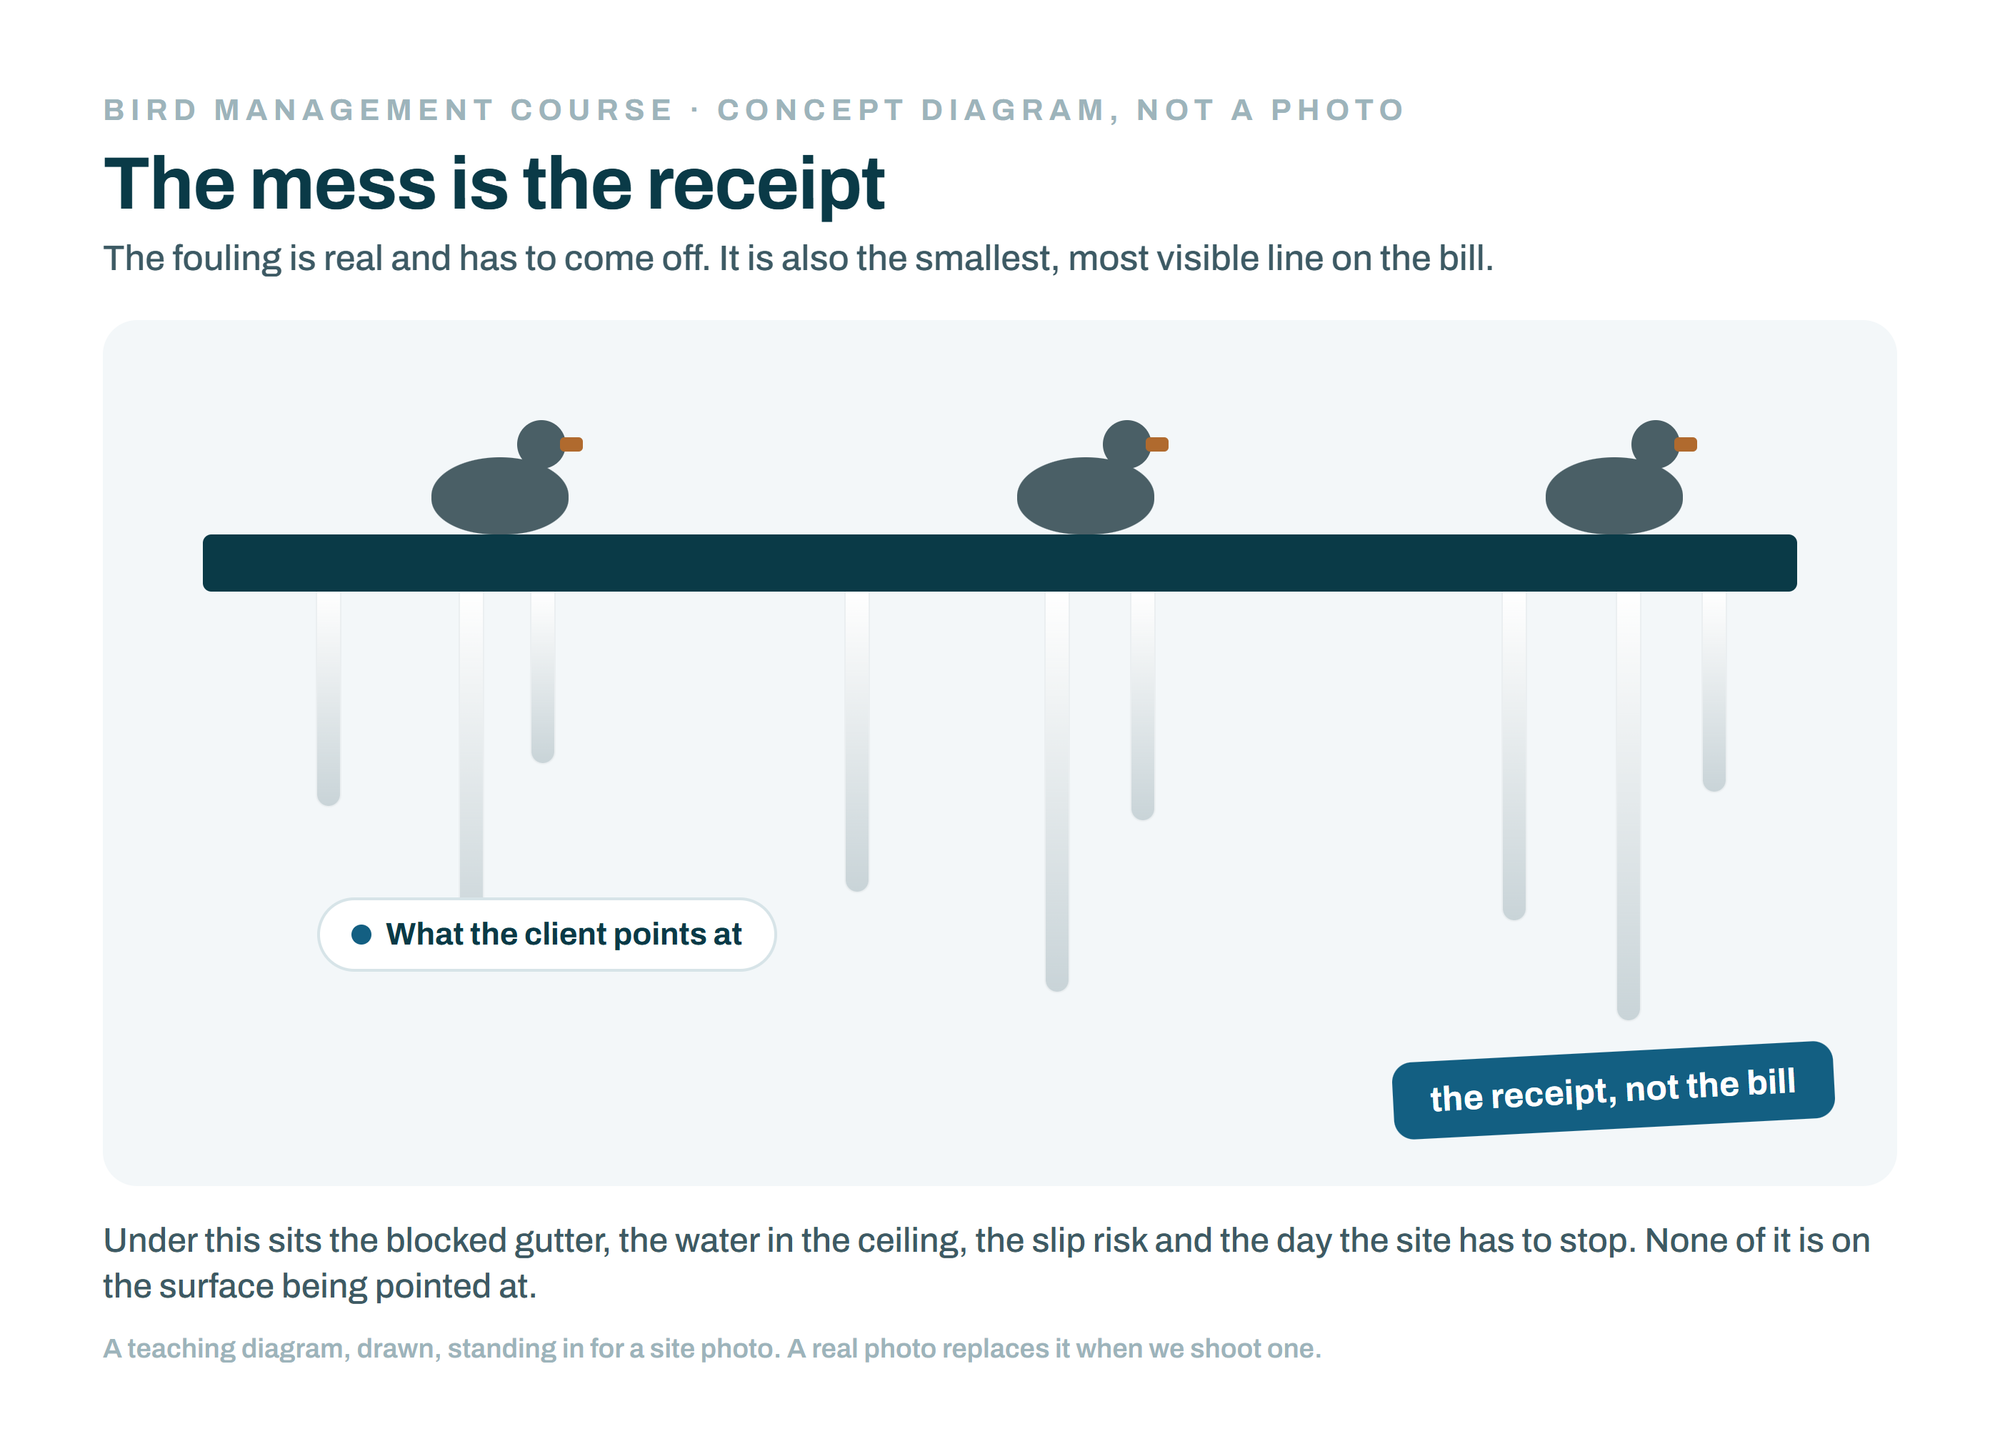
Concept diagram (not a photo): a fouled ledge with birds and dropping streaks, the visible mess a client points at. Bird Management Course, session 03.

So the first move is to widen the frame past the mess. The fouling is real and it has to come off, for safety and for how the place looks. But it is the smallest, most visible line on a running total, and the one the client has already made peace with paying. Your value is not a cheaper clean. It is showing the lines under it, still climbing while the cleaner keeps up appearances, and then switching the whole meter off.

Before you read on, bring a site with you

Think of a site where the birds became a line in a budget. A cleaning contract that renews without anyone asking why. A gutter cleared twice a year. A section washed down every Monday.

Not the day it started. What has it cost since, all in, counting the things nobody files under birds? The water damage blamed on the roof. The tenant who did not renew. The audit that got tense.

Hold onto that site. We come back to it near the end, and we add it up.

The meter, and its three lines

Here is the model, and it fits any site you will ever quote. An unmanaged bird problem is not a cost you pay once. It is a meter, and it runs every week the birds stay. There are three lines on it, and learning to name all three is the whole session.

The clean is the first line and the only one most clients see. Washing down, gurneying a deck, closing a walkway to do it. It is visible, it recurs, and it never stops while the birds are resident. It is the receipt, not the bill.

The damage is the second line, and it is bigger. It is what the birds take or wreck while nobody is keeping a tally: crop gone at harvest, a blocked drain putting water through a ceiling, a fitout tired before its time, product contaminated near an intake. This line is usually counted only after it has already been paid.

The stop is the third line, and it is the largest by a distance. It is the day the operation halts: a production hold after a failed audit, a closed public area, a flight delayed by a bird on the runway, a heritage frontage wrapped in scaffold. Rare on any one site, but when it lands it dwarfs years of the other two.

To make it concrete, the one national figure worth carrying. The Bureau of Rural Sciences put bird damage to Australian horticulture at close to 300 million dollars a year, across more than 60 species (Tracey and colleagues, 2007, working from mid 2000s values). Grapes alone accounted for more than 100 million of that. Treat it as an order of magnitude, not this year's number, because it is the most complete national estimate of its kind and it is now close to two decades old. Even hedged that hard, it tells you the meter is real and it is large.

The dropping you can see is the receipt. The bill is everything under it that nobody is adding up.
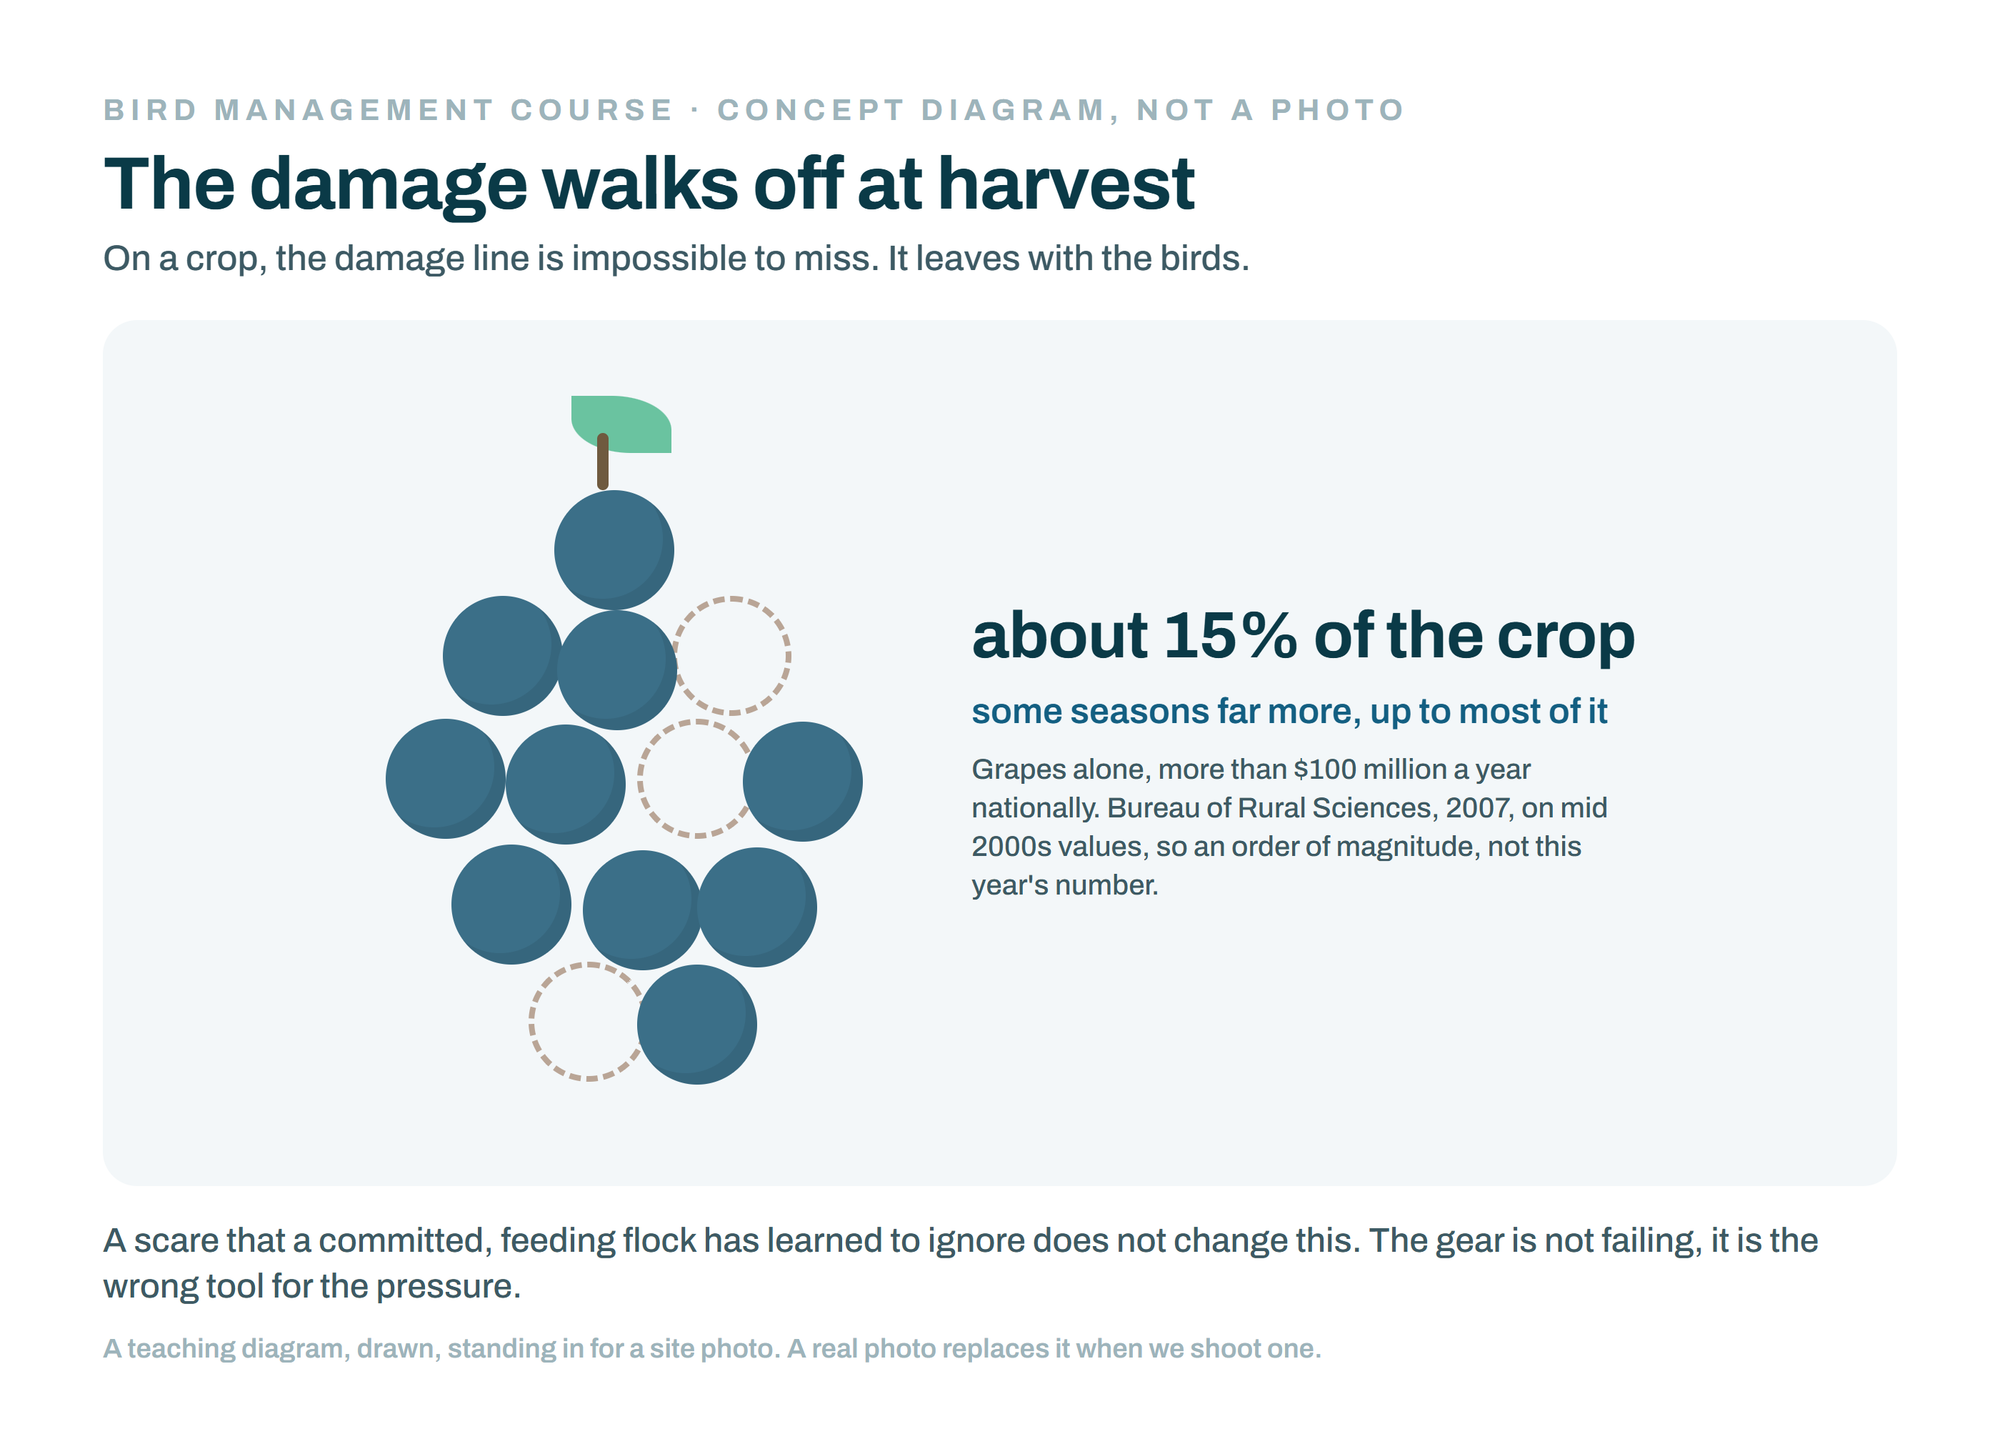
Concept diagram (not a photo): a grape bunch with part of the crop taken, the damage birds carry off at harvest. Bird Management Course, session 03.

Agriculture: where you can watch the meter run

On a crop the damage line is impossible to miss, because it walks off at harvest. In New South Wales vineyards around Orange, bird damage has averaged about 15 percent a year, and above roughly 40 percent an unnetted block stops being worth running (Bureau of Rural Sciences, 2007). The trap ties to Session 2: growers spend real money scaring every season and still lose fruit, because a scare on a committed, feeding flock habituates. The gear is not failing. It is the wrong tool for that pressure.

Airports and urban infrastructure: same meter, different biggest line
Change the sector and the meter does not change, only which line leads.

At an airport the leading line is the stop, and it is measured in safety and disruption rather than a tidy dollar. A bird through an engine can mean an aborted takeoff, an unscheduled inspection, a delay that ripples down the day, and at worst an event no one wants to describe in a training session. The scale is not small. The Australian Transport Safety Bureau recorded 24,106 birdstrikes across Australian aviation between 2008 and 2022, with the yearly count trending up and peaking at 1,921 in 2017, and wildlife strikes make up around a third of all occurrences reported to it each year. This is exactly why airports do not rely on scaring. They manage the habitat that draws birds in and exclude them from where it matters, run to the airport's own rules by people who do only that. We are not putting a dollar on a strike here, because published per strike figures vary wildly and an honest number is better than a confident guess.

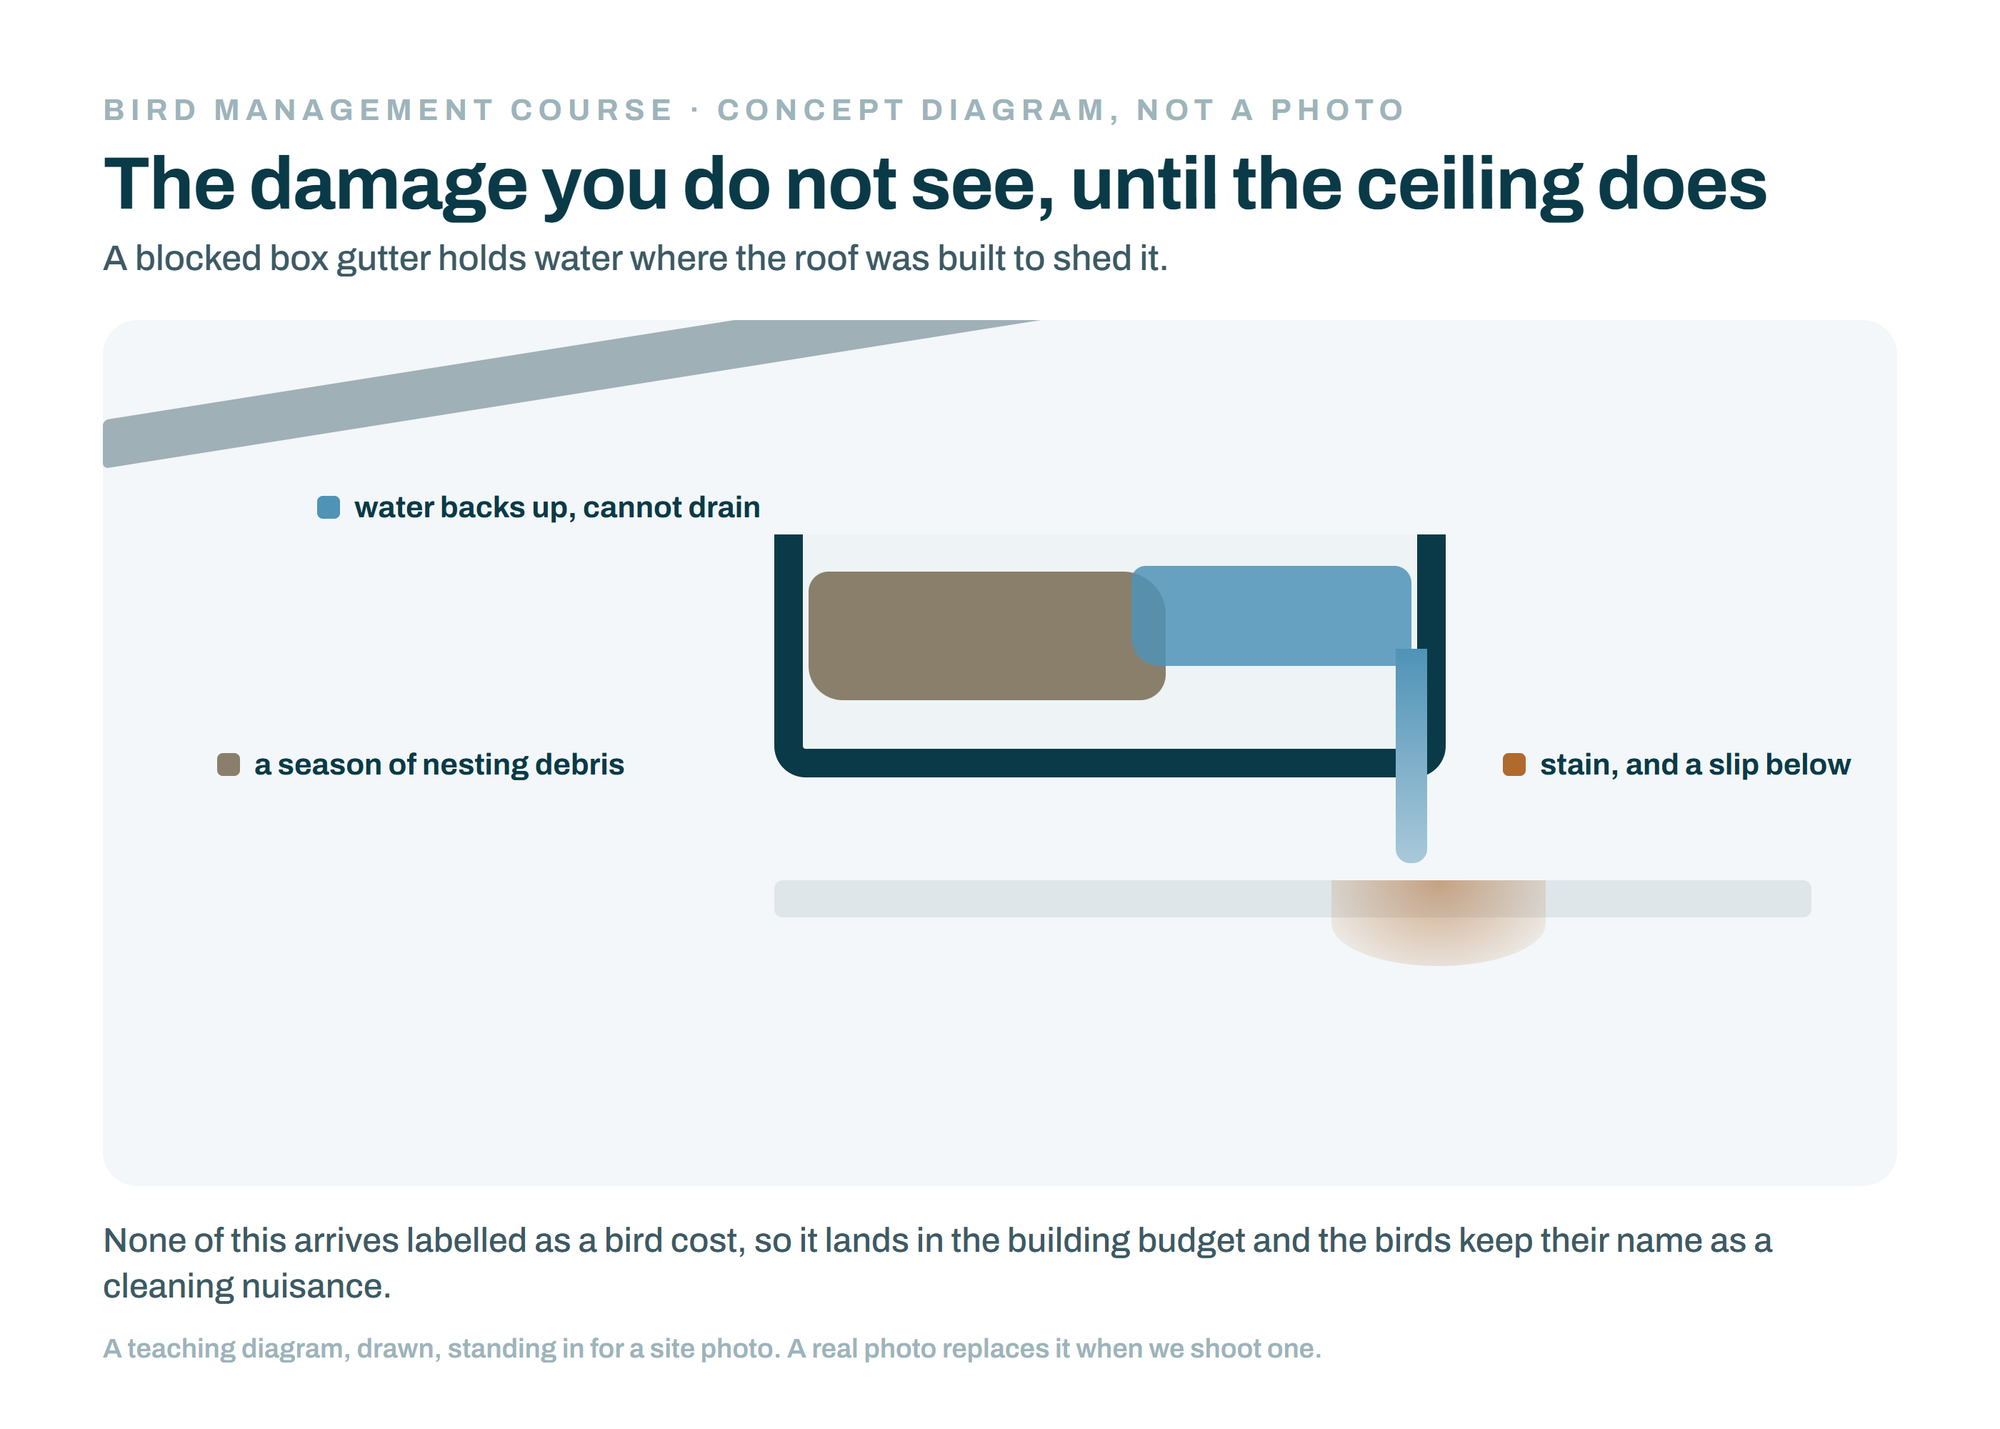
Urban infrastructure is the sector where the meter hides in plain sight. The leading line is the clean, a standing cost that quietly proves the birds are resident, and under it sits a damage line most owners never connect to birds: nesting debris blocking a box gutter until water comes through a ceiling, fouling held against a surface, drainage backing up on a flat roof. Reliable Australian dollar figures for urban fouling are patchy, so we will not wave a national total around, but the shape is consistent on site after site. A caution worth keeping honest: the common belief that droppings aggressively corrode building metals is less settled than it sounds. Recent Australian led work (Spennemann and Watson, 2018) found the evidence thinner than the folklore, so the safe line to a client is that fouling is certain, cleaning is certain, blocked drainage is certain, and corrosion is a real risk you manage rather than a law of physics you assert.

Concept diagram (not a photo): a box gutter blocked with nesting debris, water backing up and staining the ceiling below. Bird Management Course, session 03.

Change the sector and the meter does not change, only which line leads.

At an airport the leading line is the stop, and it is measured in safety and disruption rather than a tidy dollar. A bird through an engine can mean an aborted takeoff, an unscheduled inspection, a delay that ripples down the day, and at worst an event no one wants to describe in a training session. The scale is not small. The Australian Transport Safety Bureau recorded 24,106 birdstrikes across Australian aviation between 2008 and 2022, with the yearly count trending up and peaking at 1,921 in 2017, and wildlife strikes make up around a third of all occurrences reported to it each year. This is exactly why airports do not rely on scaring. They manage the habitat that draws birds in and exclude them from where it matters, run to the airport's own rules by people who do only that. We are not putting a dollar on a strike here, because published per strike figures vary wildly and an honest number is better than a confident guess.

Urban infrastructure is the sector where the meter hides in plain sight. The leading line is the clean, a standing cost that quietly proves the birds are resident, and under it sits a damage line most owners never connect to birds: nesting debris blocking a box gutter until water comes through a ceiling, fouling held against a surface, drainage backing up on a flat roof. Reliable Australian dollar figures for urban fouling are patchy, so we will not wave a national total around, but the shape is consistent on site after site. A caution worth keeping honest: the common belief that droppings aggressively corrode building metals is less settled than it sounds. Recent Australian led work (Spennemann and Watson, 2018) found the evidence thinner than the folklore, so the safe line to a client is that fouling is certain, cleaning is certain, blocked drainage is certain, and corrosion is a real risk you manage rather than a law of physics you assert.

What the meter tells you before you write the quote

Put the two halves of the course together and a quoting method falls out.

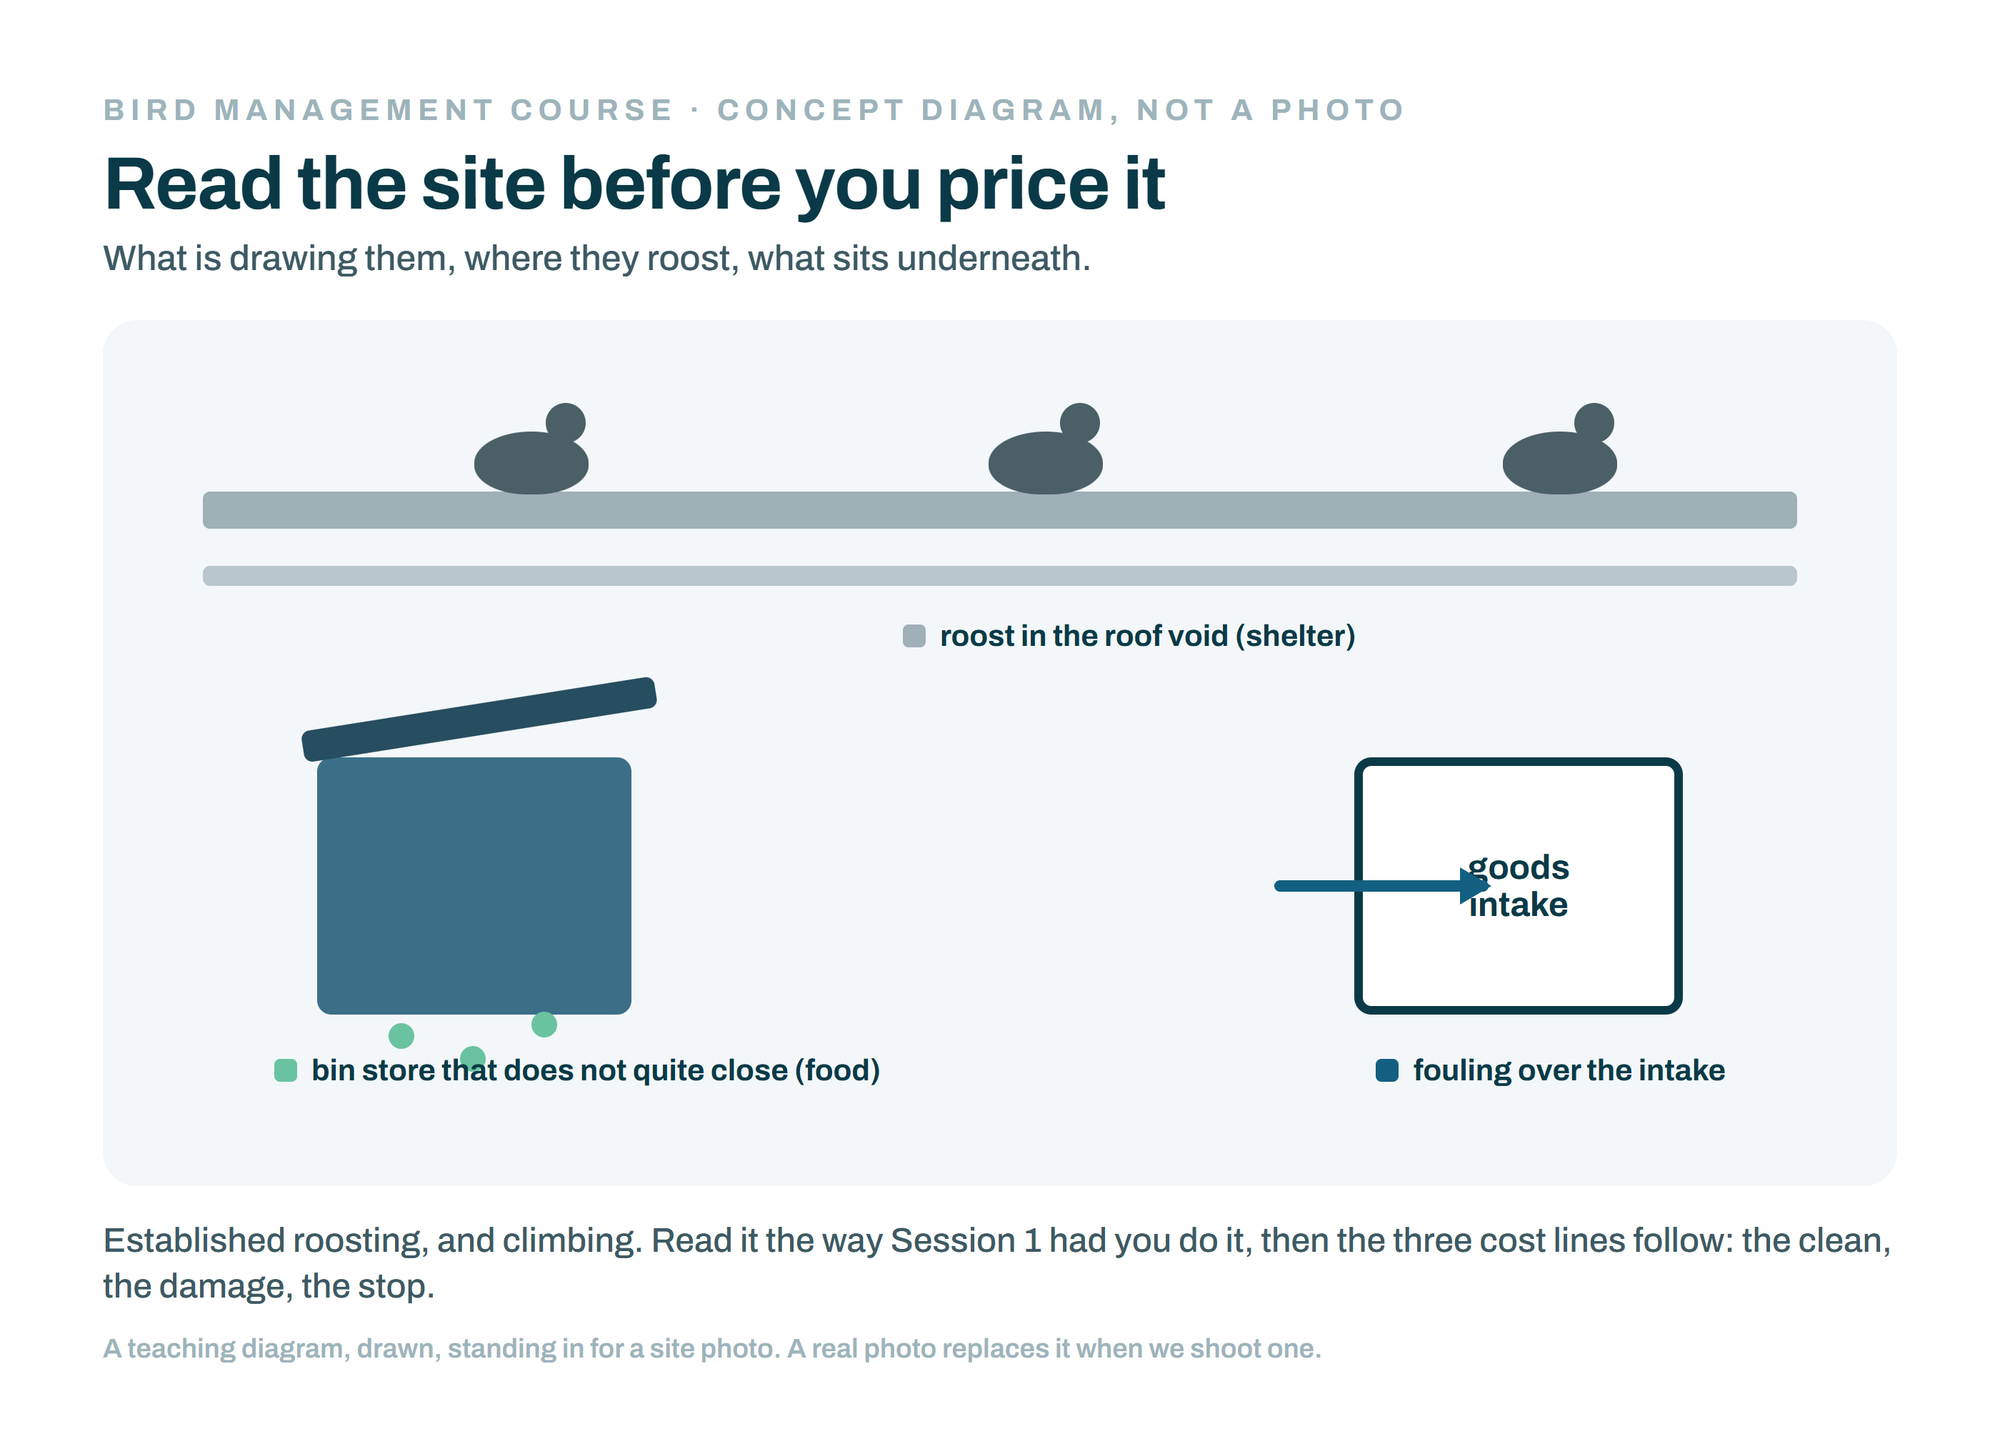
Read the pressure first, the way Session 1 had you do it. The pressure tells you which lines of the meter are running. Low pressure, casual birds, and it is mostly the clean, now and then. Established roosting or nesting, and all three lines are live and the damage and the stop are climbing. You have not opened a catalogue and you already know the shape of the cost.

Then price the meter, not the mess. Add up what the site is already spending to hold the problem steady: the cleaning that renews, the gutter clears, the odd bit of water damage, the management hours. That running total, not your product, is the number that matters, because it is what the client keeps paying if nothing changes.

Then quote the fix as switching the meter off. This is the same move Session 1 made with the sparrow job: you are not warning the client, you are offering them the discount. The gap between paying the meter forever and ending it once is the strongest, and the most honest, argument you have. And it lands hardest when you have matched the method to the pressure, so the fix actually holds and the meter actually stops, instead of resetting the day the birds test it.

Field Note

Peter has watched this land in boardrooms more than once. The number that changes a client's mind is almost never the quote, it is the total they have already spent without noticing. Pull the cleaning invoices for three years, add the gutter clears and the bit of water damage everyone blamed on the roof, and put that figure next to a one off fix. It stops being a cost and starts being a saving, and the person who has to sign it off can finally see why. The mistake is leading with the price of the netting. Lead with the meter, and the netting looks cheap.

"Peter McCarthy: the number that moves a client is not your quote, it is the total they have already paid without noticing."

Peter Mccarthy
About this series

This session is part of the Bird Management Course by Pest IT. It draws on "A Guide to Pest Bird Management" (2021) by Peter McCarthy and Dr Sali Bache, and on the field record behind it. The national figure for bird damage to Australian horticulture, close to 300 million dollars a year across more than 60 species, and the crop and vineyard figures (grapes above 100 million dollars a year, Orange district damage averaging about 15 percent and unnetted operations becoming uneconomic above about 40 percent, and growers spending on scaring while still losing fruit), are from Tracey, Bomford, Hart, Saunders and Sinclair, "Managing Bird Damage to Fruit and Other Horticultural Crops," Bureau of Rural Sciences, Canberra, 2007, which worked from mid 2000s Australian Bureau of Statistics values. Those are the most complete national estimates of their kind and are now close to two decades old, so they are used here as orders of magnitude rather than current figures. The birdstrike counts (24,106 birdstrikes across Australian aviation from 2008 to 2022, a peak of 1,921 in 2017, and wildlife strikes making up around a third of reported occurrences) are from the Australian Transport Safety Bureau's aviation wildlife strike statistics; no dollar figure is put on a strike here because published per strike costs vary too widely to state responsibly. The status of the common starling as a declared pest and its damage to cherries and grapes is per the Western Australian Department of Primary Industries and Regional Development. On urban corrosion, recent Australian led work by Spennemann and Watson (APT Bulletin, 2018) found the evidence that droppings aggressively corrode architectural metals thinner than the common belief, so corrosion is framed here as a managed risk, not asserted. Where a species' legal status or a site's compliance obligation comes up, it varies by state, territory and situation, so confirm the current position before acting on it, and the law sessions later in this module cover it in detail. The food manufacturing walkthrough is a composite of jobs of this kind, built to carry the teaching rather than to describe one identifiable site.